Dashboard
The Shield Administration Console dashboard includes useful data, allowing the administrator to quickly understand the system status and analyze problematic issues.
The dashboard is constantly refreshed, to display up-to-date information.
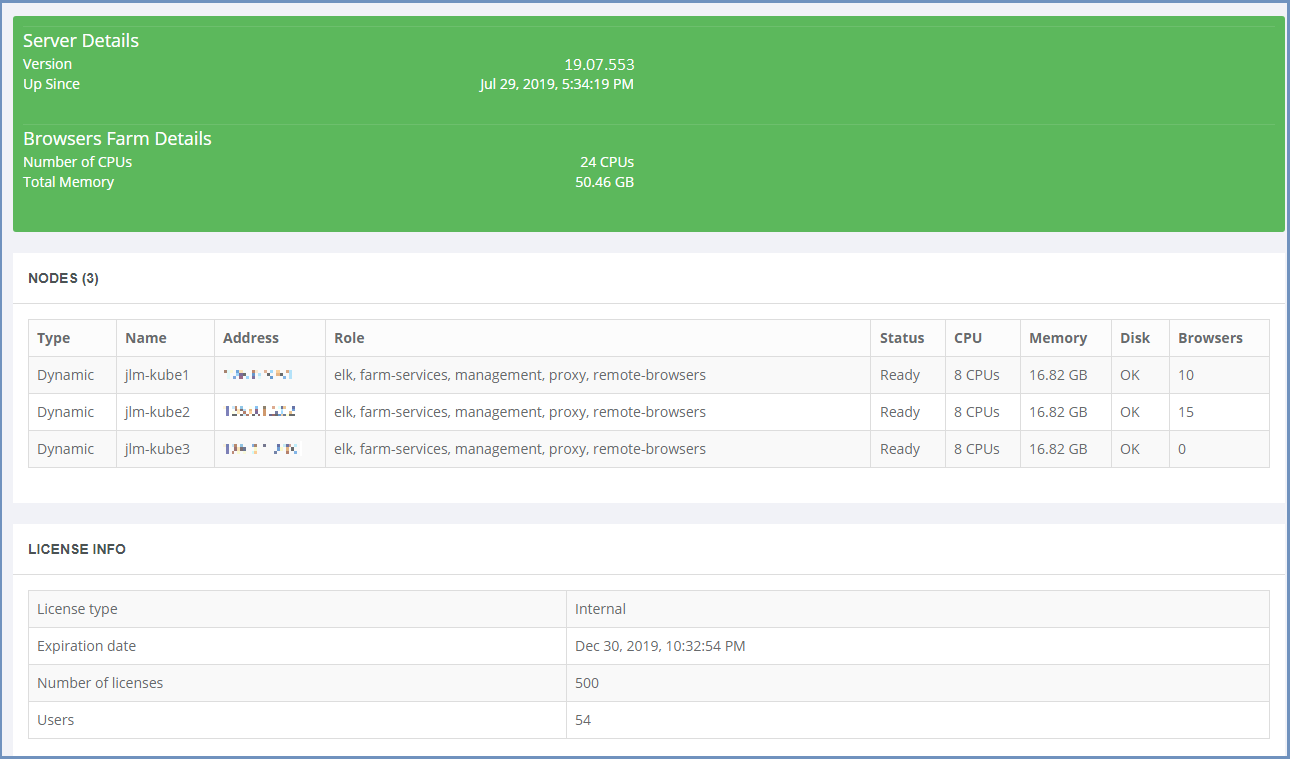
The dashboard includes the following components:
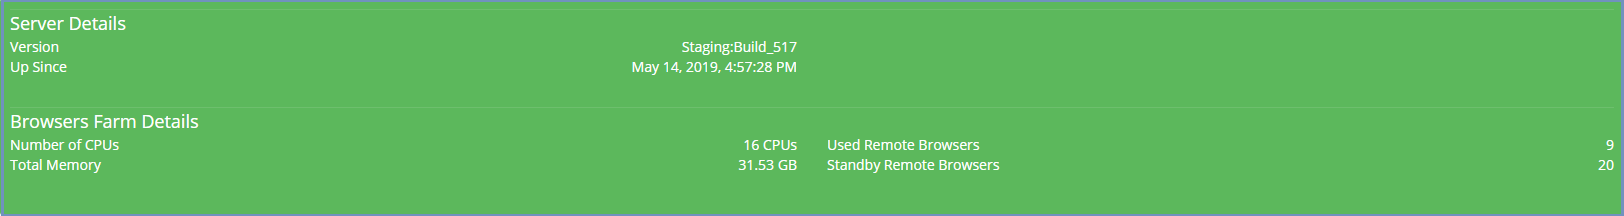
- System status and browsers farms details: includes data related to the Shield system itself, to easily determine if the system requires attention. When there is a problematic situation that requires attention, an alert is displayed in this area of the dashboard. The alert can be issued in various situations and can be one of 2 levels: Warning (marked yellow) and Critical (marked red).
For more information about the notifications and alerts mechanism, please see below.
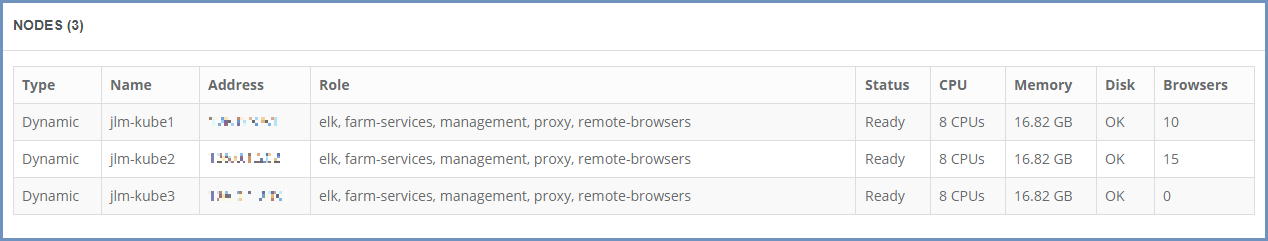
Nodes: includes a table displaying the different nodes in the system, includes the following data:
- Type - whether it is a Static or Dynamic node
- Name
- Address
- Role - which components are installed on this node
- Status
- CPU & Memory - actual and usage (%)
- Disk - for Static values are the actual disk space and usage (in %). For Dynamic the values are OK/Pressure
- Number of Browsers - populated only if the node includes Shield browsers on it
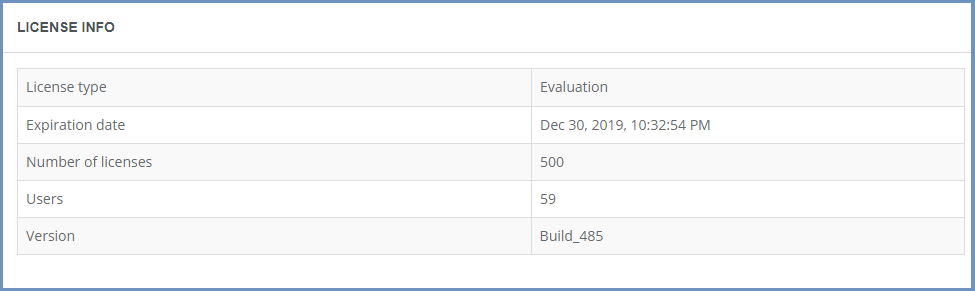
- License Information: includes license type, expiration date, total number of licenses and actual number of licenses in use.
Notifications and Alerts
Ericom Shield includes a notification and alerts mechanism. The system collects information about various parameters and according to this information, once irregular data is captured and a problematic situation is recognized, a notification is issued and an alert is displayed in the dashboard.
For a detailed list of possible alerts, see here.
The alert includes a colored indicator in the upper section of the dashboard. The green area turns to yellow or red, according to the severity of the alert.
Once the problematic situation is resolved (e.g. the License Expiration Date has be prolonged) the alert is closed and the notification disappears from the dashboard.