Reports
This section allows retrieving data and info collected using Kibana. These reports are displayed in a graphical and informative manner. The available report categories are:
- Connections - displays information about browsing sessions, domains and categories in the Shield system.
- System - displays information about the system, technical status of user sessions and browser sessions.
- File Transfer - displays information about file transfer in the system, which files were downloaded, which blocked and which sanitized successfully.
- Errors - displays the errors that are issued by Shield components which have the severity of Error/Fatal.
Note
Some reports are missing from Rel-19.07.1. Efforts are being made to retrieve these reports in the upcoming release.
To retrieve the info, select the category, the type of the report and the time filter and press Run.
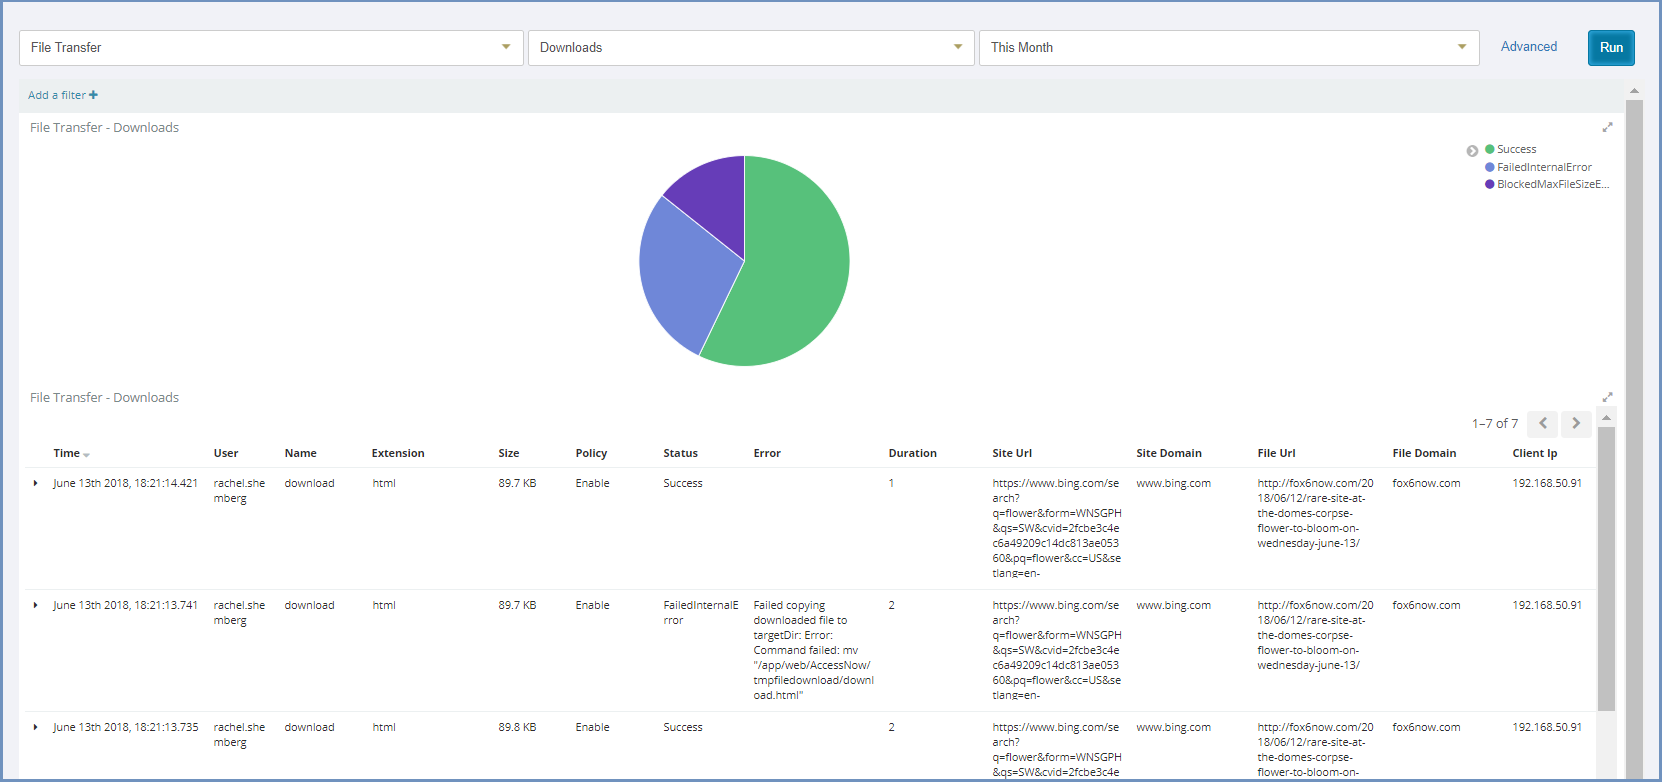
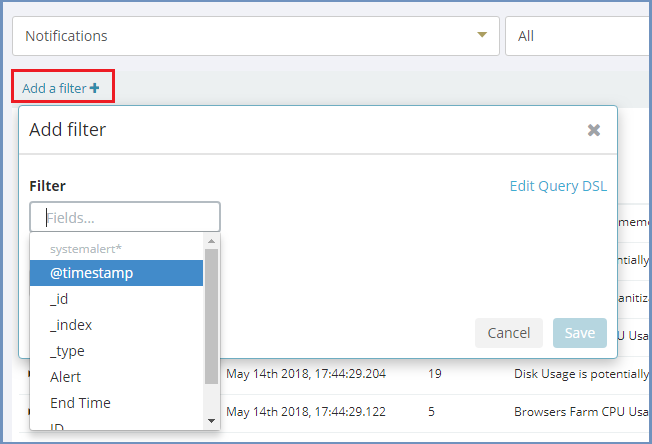
In the report result, it is possible to use the Kibana infrastructure and add more filters, using the Add a filter link.
Click the Advanced link to open Kibana in a new tab, for an enhanced view of system logs.