Dashboard
The Shield Administration Console dashboard includes useful data, allowing the administrator to quickly understand the system status and analyze problematic issues.
The dashboard is constantly refreshed, to display up-to-date information.
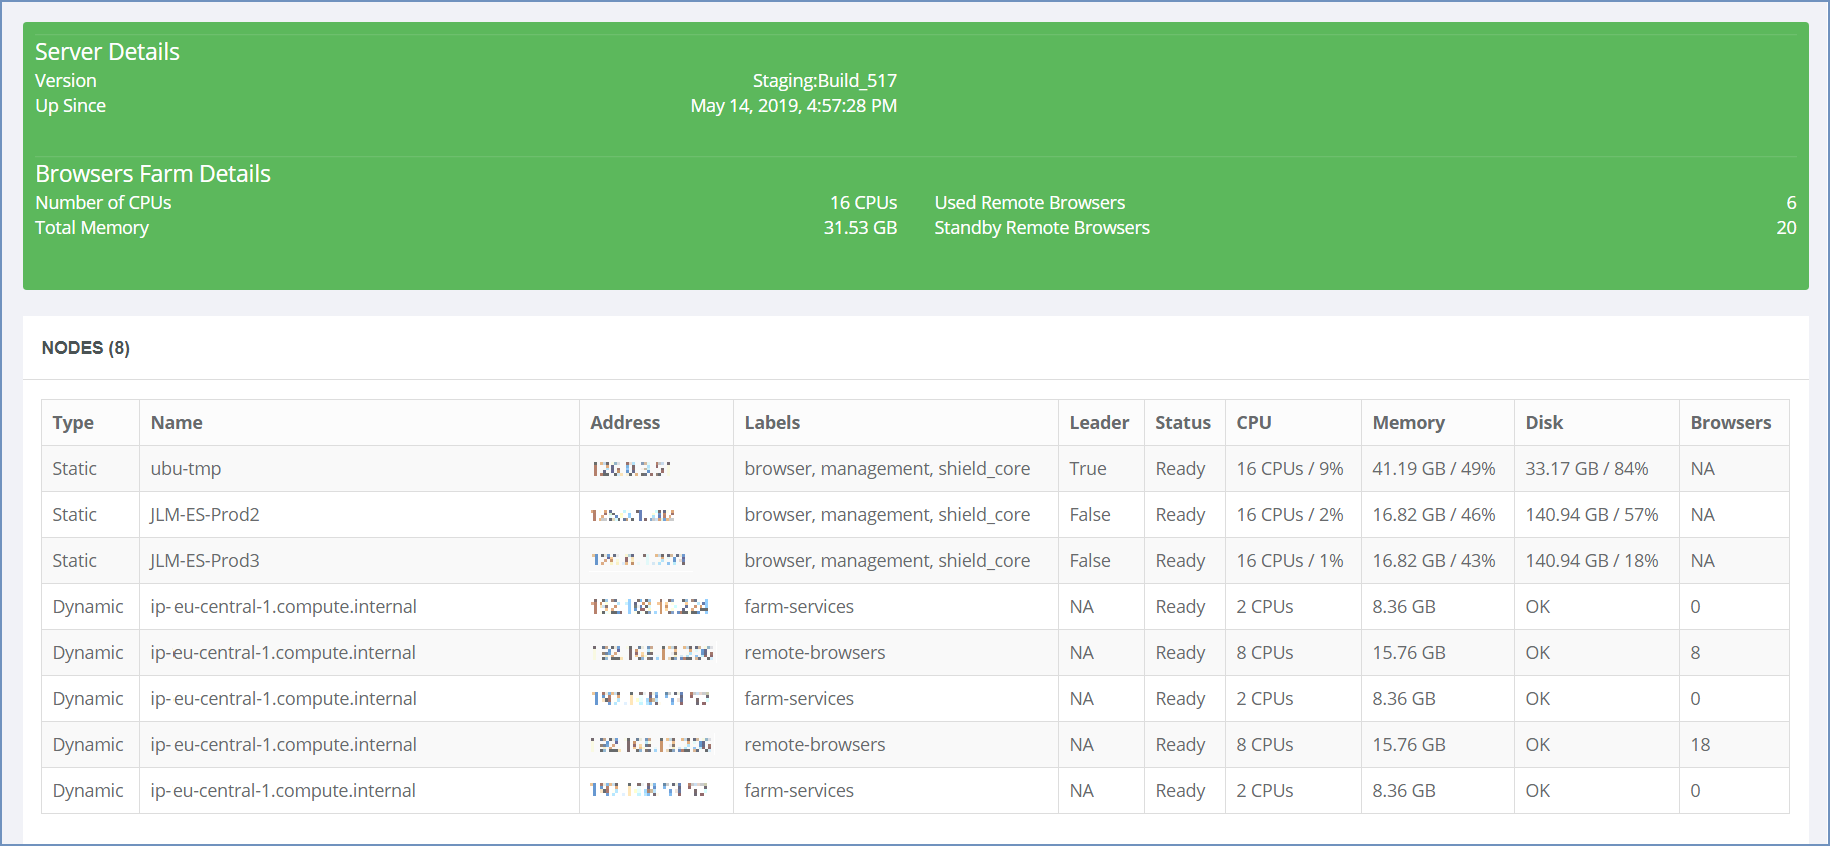
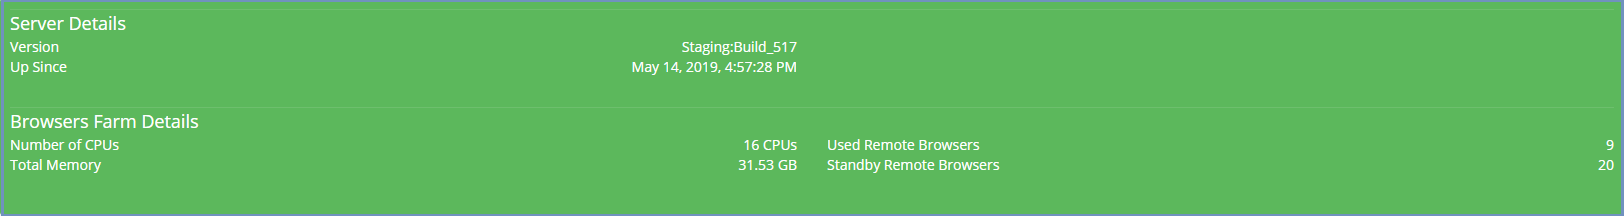
The dashboard includes the following components:
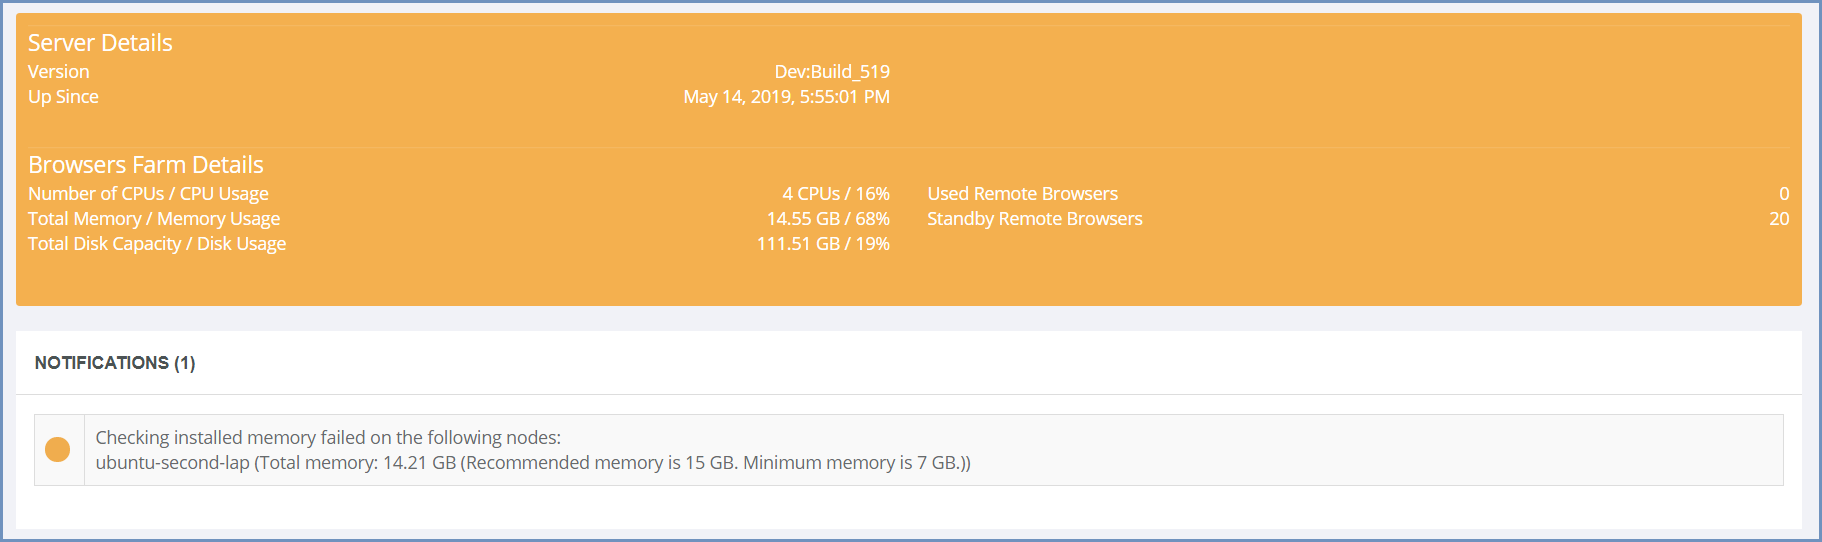
- System status and browsers farms details: includes data related to the Shield system itself, to easily determine if the system requires attention. When there is a problematic situation that requires attention, an alert is displayed in this area of the dashboard.
The alert can be issued in various situations and can be one of 2 levels: Warning (marked yellow) and Critical (marked red). For more information about the notifications and alerts mechanism, please see below.
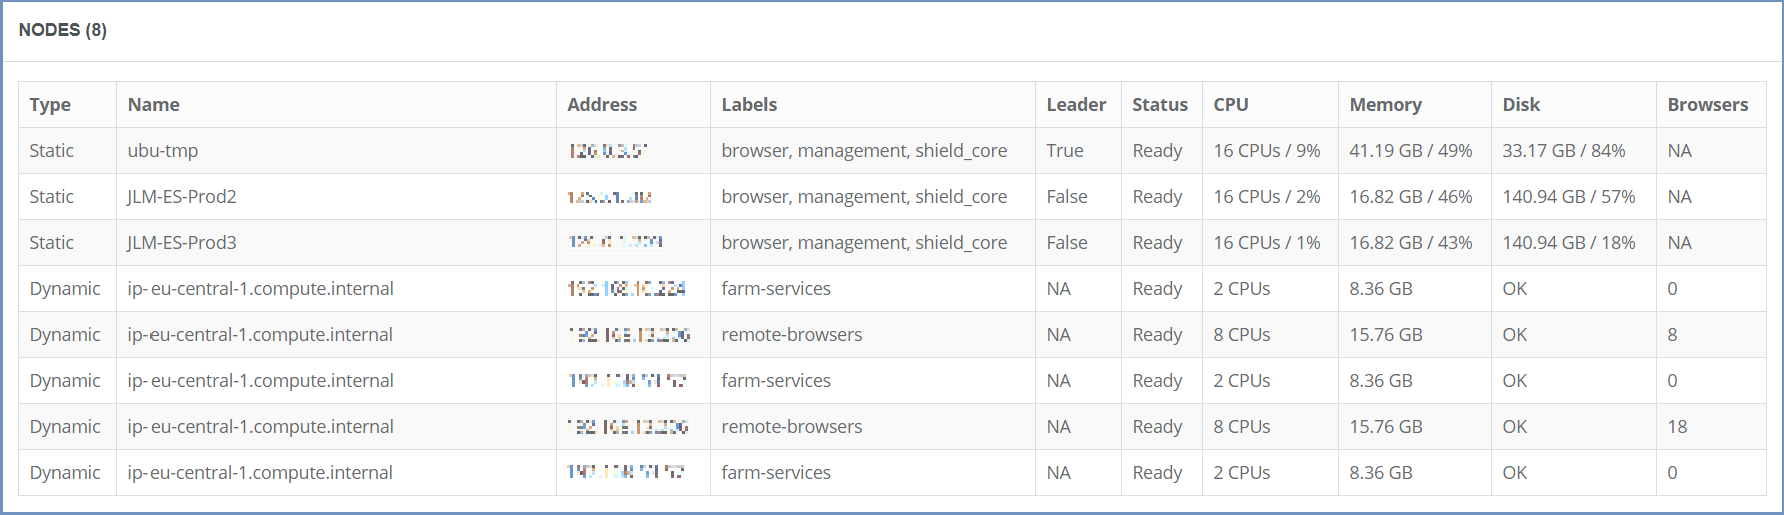
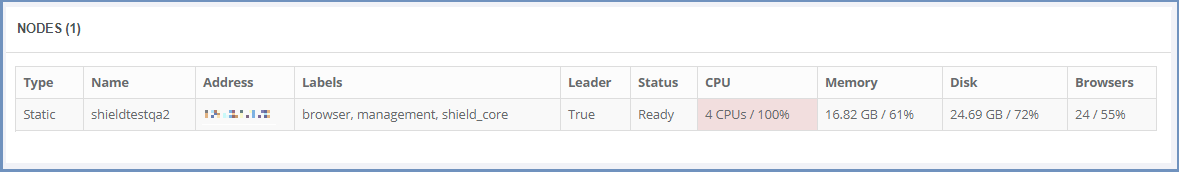
Nodes: includes a table displaying the different nodes in the system, includes the following data:
- Type - whether it is a Static or Dynamic node
- Name
- Address
- Labels - which components are installed on this node
- Leader - True/False/NA
- Status
- CPU & Memory - actual and usage (%)
- Disk - for Static values are the actual disk space and usage (in %). For Dynamic the values are OK/Pressure
- Number of Browsers - populated only if the node includes Shield browsers on it
Note
When the browsers farm is dynamic - the static nodes in the system are not used to run browsers, regardless if defined with the label “Browsers”. All browsers will be created and managed on the dynamic nodes.
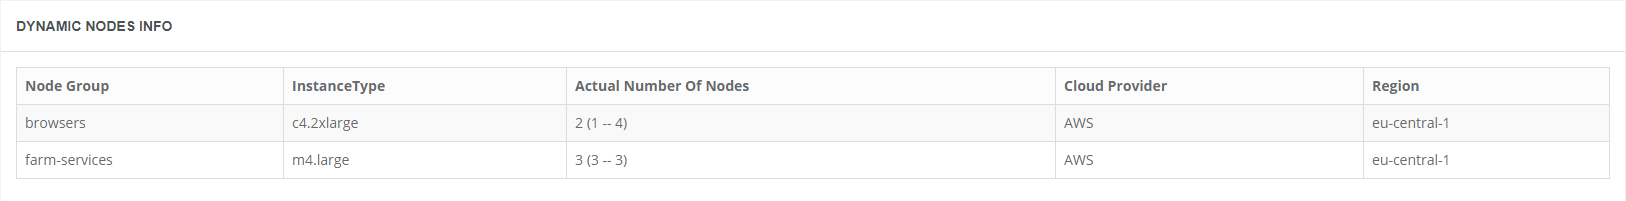
- Dynamic Nodes Information: this section is part of the dashboard only when dynamic nodes exist in the system. The table includes details on the dynamic nodes in the system: cloud, region, node group, instance type and number of nodes (actual/min/max).
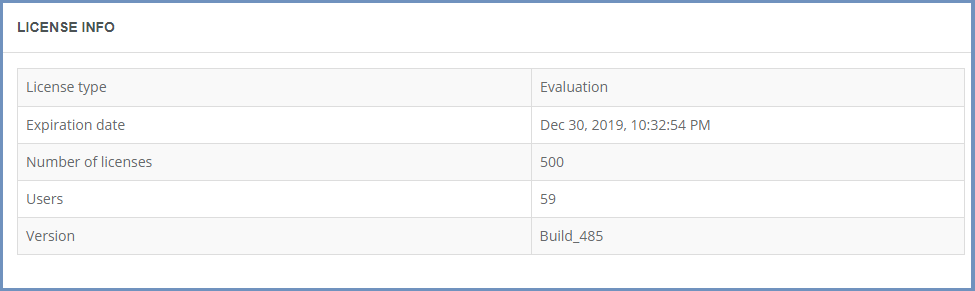
- License Information: includes license type, expiration date, total number of licenses and actual number of licenses in use.
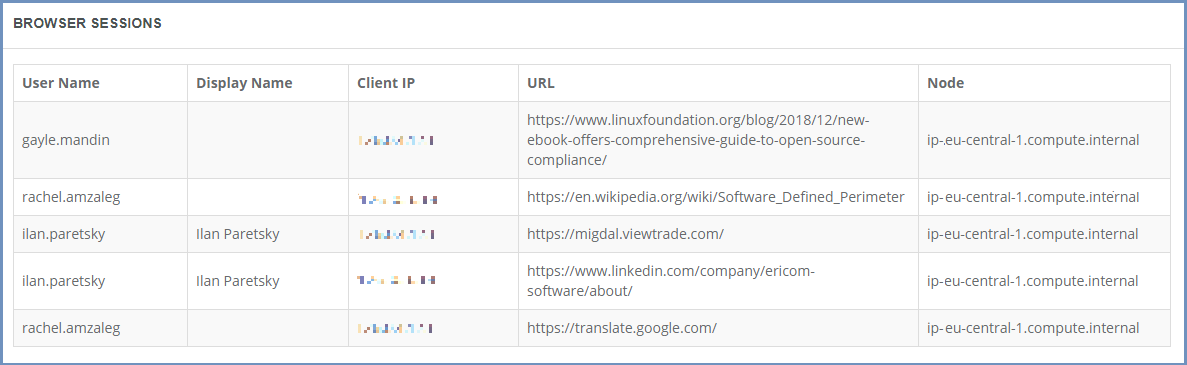
- Browser sessions: lists active browsers sessions and their details
Notifications and Alerts
Ericom Shield includes a notification and alerts mechanism. The system collects information about various parameters and according to this information, once irregular data is captured and a problematic situation is recognized, a notification is issued and an alert is displayed in the dashboard.
The notifications and alerts are displayed in the following scenarios: 1. If the system requires activation 2. If the licenses are about to expire (warning) or expiration date has passed (critical) 3. If the number of licenses is exceeded or about to run out (90% usage) 4. If the Browsers Farm average CPU/disk/memory usage is high (85% - warning, 95% - critical) 5. If there is an authentication related error (according to the Profiles section, critical) 6. If the CDR server cannot be reached 7. If the DNS is slow or down 8. If there is a high number of errors that were recently logged in the system 9. If there are domains that are loaded too slowly
The alert includes a colored indicator in the upper section of the dashboard (yellow/red). In addition, a new section is displayed in the dashboard - the Notifications table, including a colored indicator and a notification text.
Certain situations might be indicated at the nodes level, in the nodes table.
Once the problematic situation is resolved (e.g. the License Expiration Date has be prolonged, or CPU is back in the normal range) the alert is closed and the notification disappears from the dashboard. All notifications (both resolved and currently active) are recorded. A dedicated report exists in the Reports section.