How To Check Shield Status
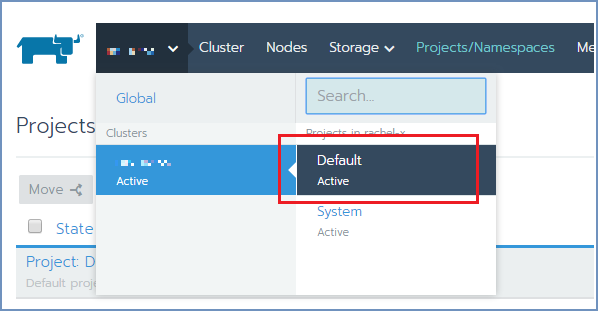
To check Shield system status, open Rancher and go to the cluster and select the Default option.
Under Workloads, all namespaces and their deployments are displayed, each with a visual status indicator (green indicator = Healthy).
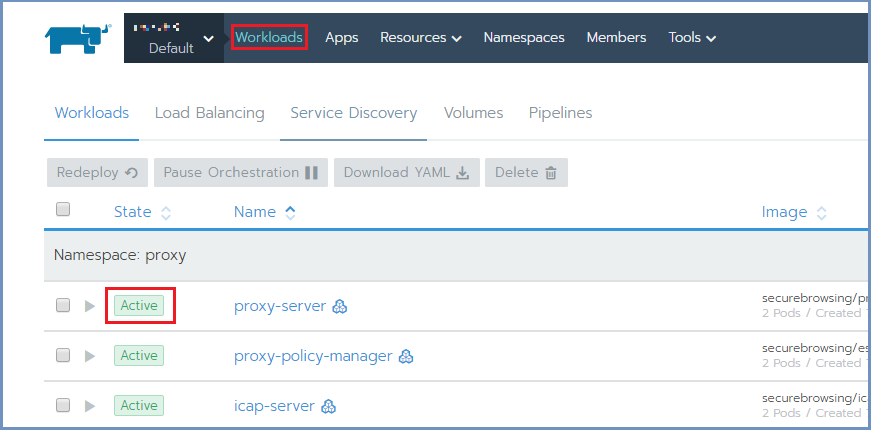
It is possible to sort the list by State and then easily see if there are unhealthy deployments.
Repair Unhealthy Deployments
If a deployment is unhealthy the visual indicator will be orange/red in color (depending on the severity of the problem).
To fix this issue, select the unhealthy deployments and choose the Redeploy option.
If this option does not result as expected (some issues still remain), try the following:
Select the unhealthy deployment. The relevant pods are now displayed, each with a visual status indicator.
Select the unhealthy pod(s) and click Delete. New and healthy pod(s) will be immediately created.
Unhealthy Controller Manager and Scheduler
If Rancher includes messages/alerts regarding unhealthy controller manager and/or controller scheduler:
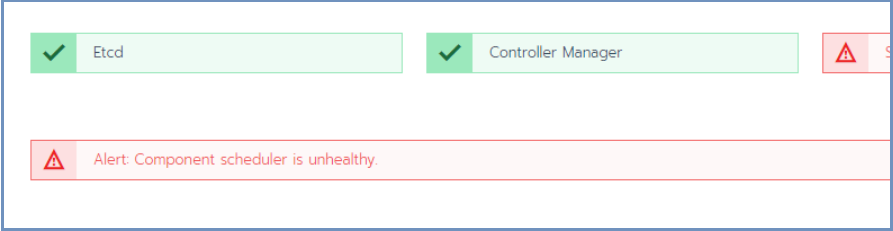
Some containers may be in Waiting mode, but wit no events or logs.
To solve this situation - restart the cluster management machines using:
sudo reboot
Collect Shield Information
When there is an issue that requires further investigation by Ericom Support, use the shield-support service and send the output to Ericom for handling.
To run this service, follow these steps:
        curl -s -o shield-support.sh https://raw.githubusercontent.com/EricomSoftwareLtd/Shield/Rel-20.03/Utils/shield-support.sh
chmod +x shield-support.sh
sudo ./shield-support.sh
This service collects information about the: system, docker, Rancher, and Shield and creates a zipped tar file with all this information in it.
The tar file is located under the hidden /tmp folder.
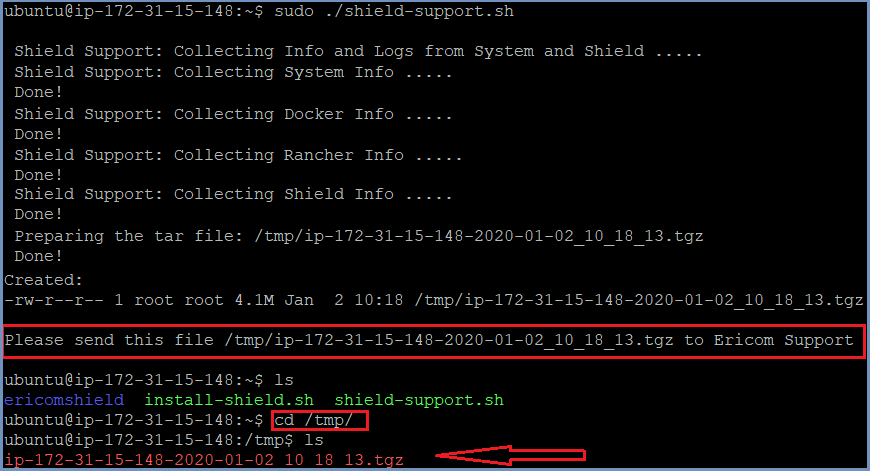
Download this tar file locally (e.g. using winSCP) and send it to Ericom Shield Professional Services team.