Reports
This section allows retrieving data and info collected using Kibana. These reports are displayed in a graphical and informative manner. The available report categories are:
- Connections - displays information about browsing sessions and browsing analysis in the Shield system.
- Users - displays information about named users, currently active users and currently active sessions in the system.
- System - displays information about the system, technical status of user sessions and browser sessions.
- File Transfer - displays information about file transfer in the system, which files were downloaded, which blocked and which sanitized successfully.
- Errors - displays the errors that are issued by Shield components which have the severity of Error/Fatal.
- End User Feedback - displays the feedback submitted by end users (using the right click menu option).
- Applications - displays information about applications in the Shield system.
- Notifications - displays information about all the notifications that are issued in the system (shown in the dashboard).
- Analyzer - displays the results of the full system health checks, performed via the Analyzer section.
- Max Users Sessions - displays the maximum number of users and sessions per day.
To retrieve the info, select the category, the type of the report and the time filter and press Run.
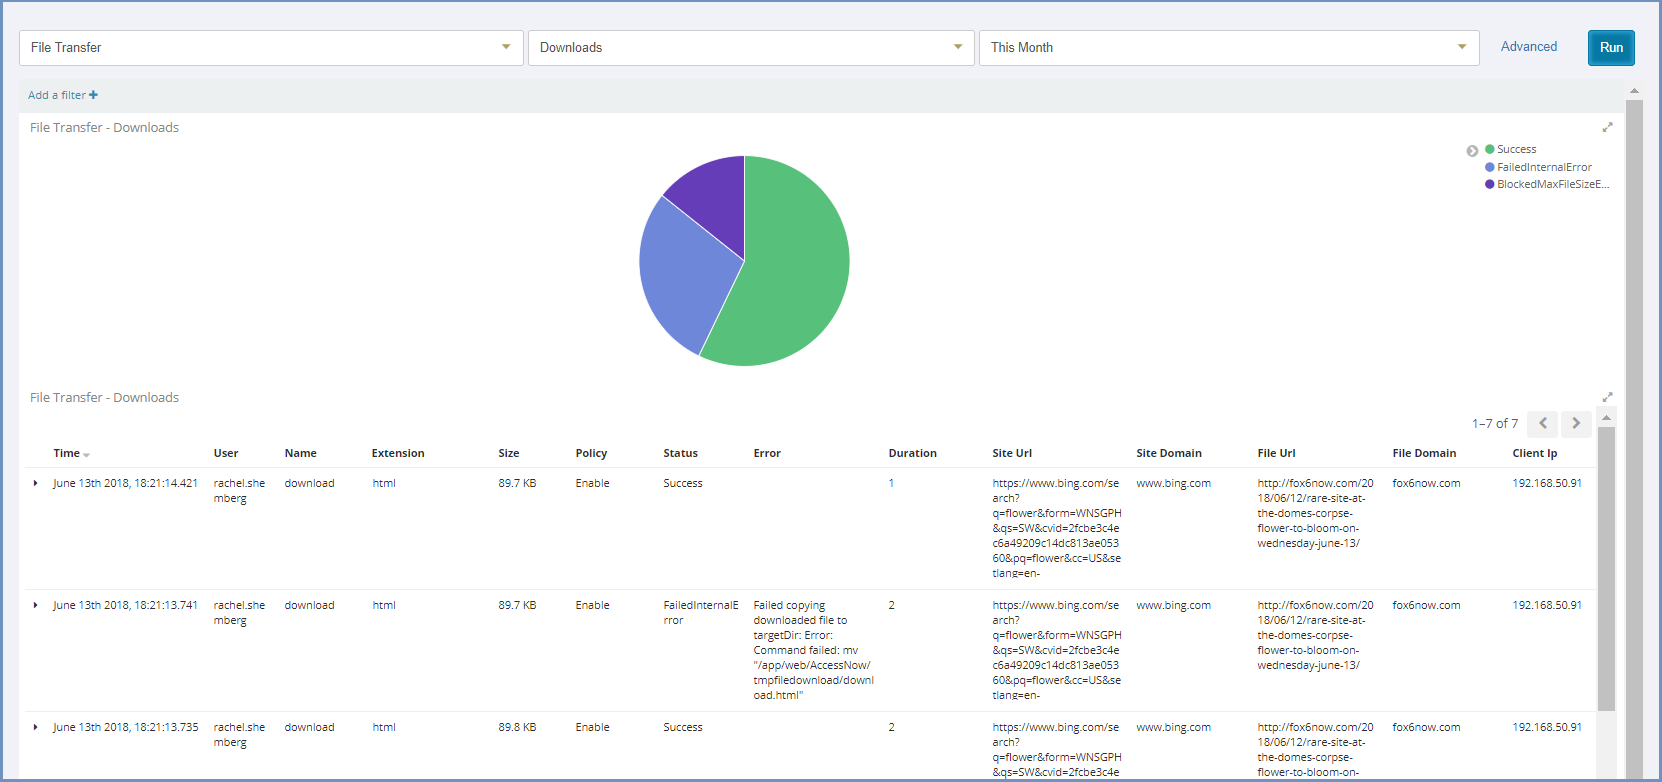
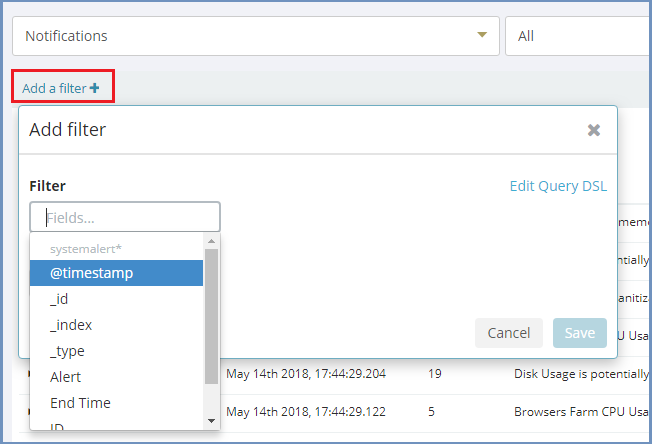
In the report result, it is possible to use the Kibana infrastructure and add more filters, using the Add a filter link.
Click the Advanced link to open Kibana in a new tab, for an enhanced view of system logs.